Native Hawaiian/Pacific Islander populations in Utah
Population
More than 53,000 people who identify as Native Hawaiian/Pacific Islander* reside in Utah.1 People of Tongan, Samoan, and Native Hawaiian ancestry comprise 82% of Native Hawaiian/ Pacific Islander* populations in the state. About one in four people of Tongan descent living in the United States live in Utah.1 Additional Pacific Islander populations in Utah include those with Chamorro, Fijian, and Marshallese ancestries. Nearly 53% of Native Hawaiian/Pacific Islander* populations living in Utah reside in Salt Lake County.1 Native Hawaiian/Pacific Islander** populations in Utah increased by 52% between 2010 and 2020.2
Sociodemographics
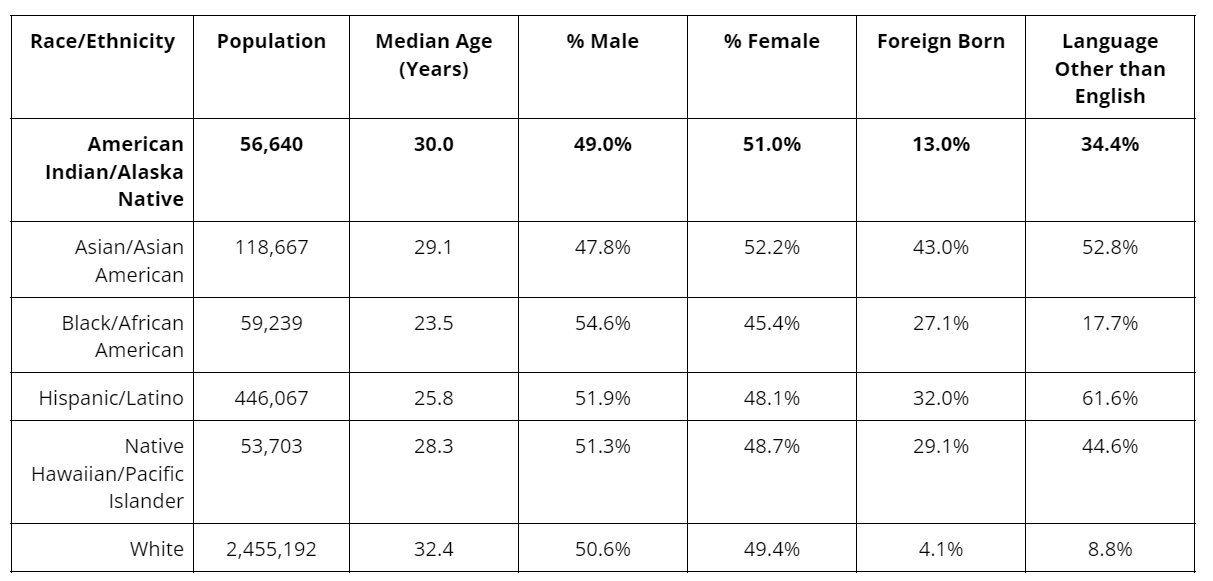
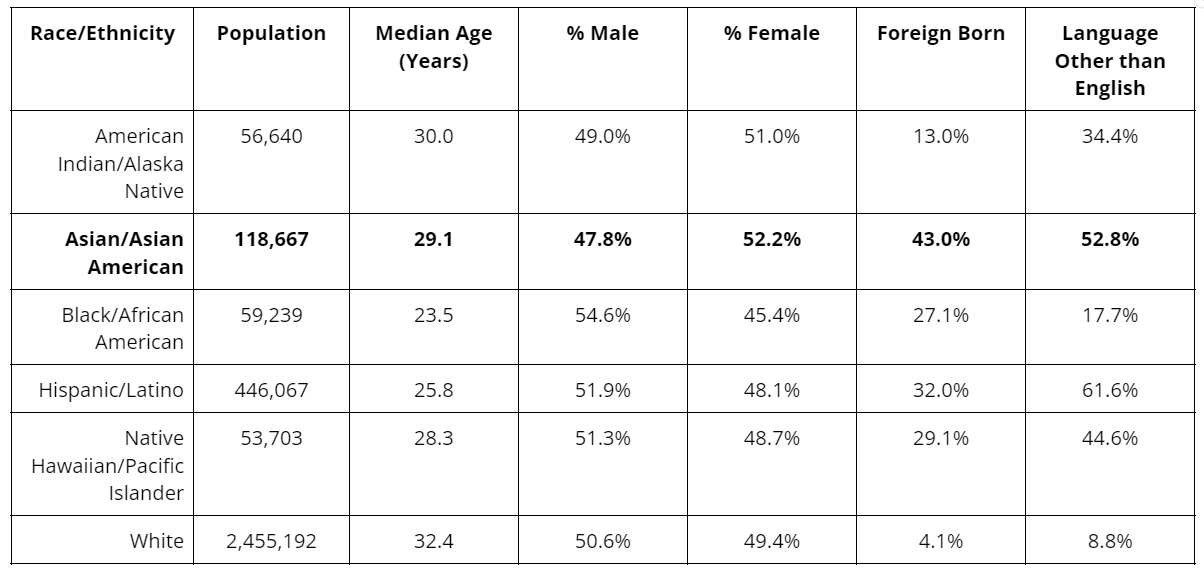
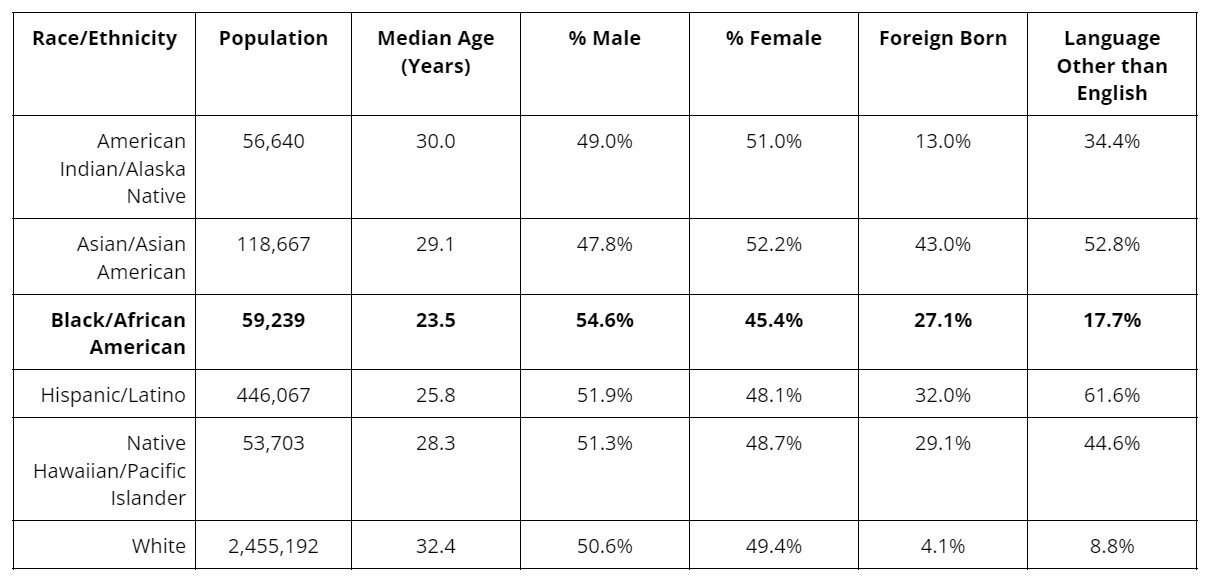
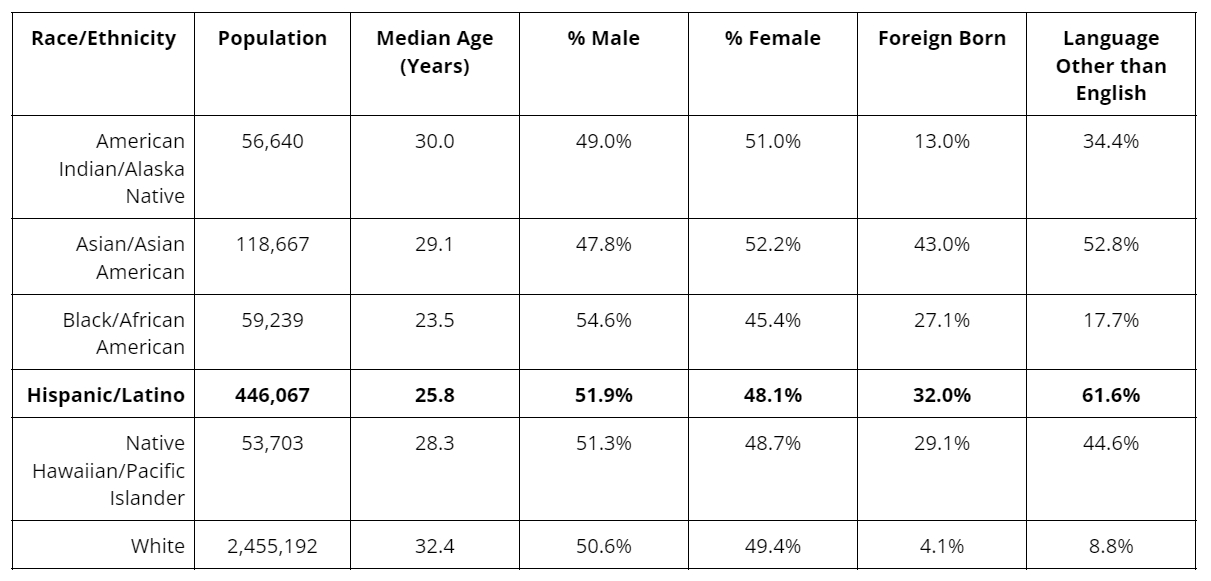
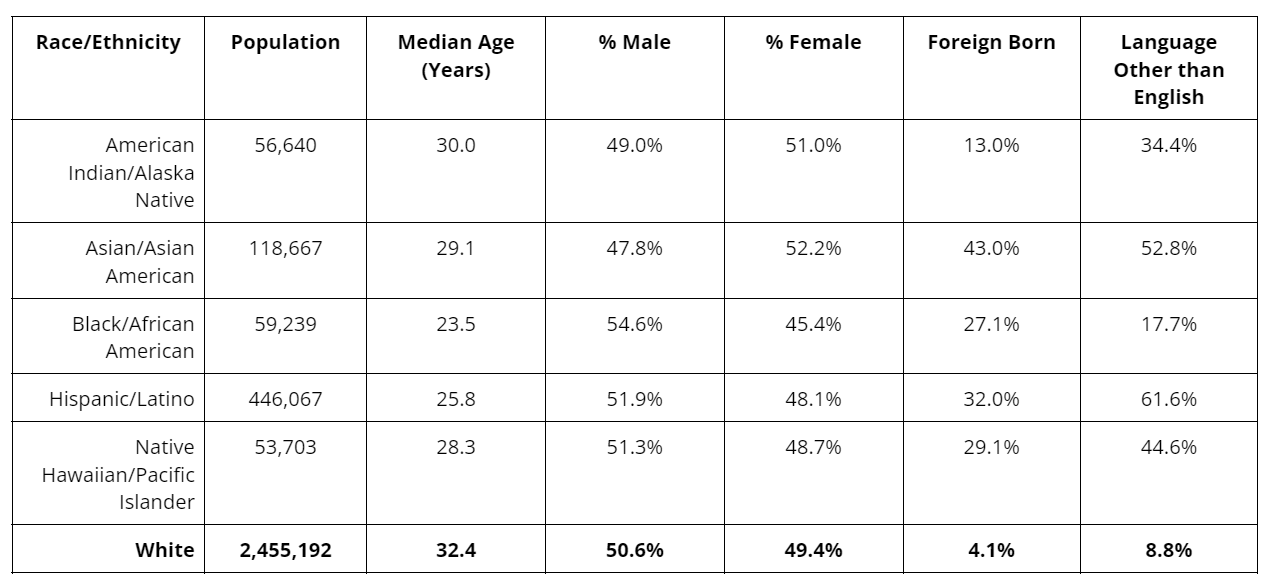
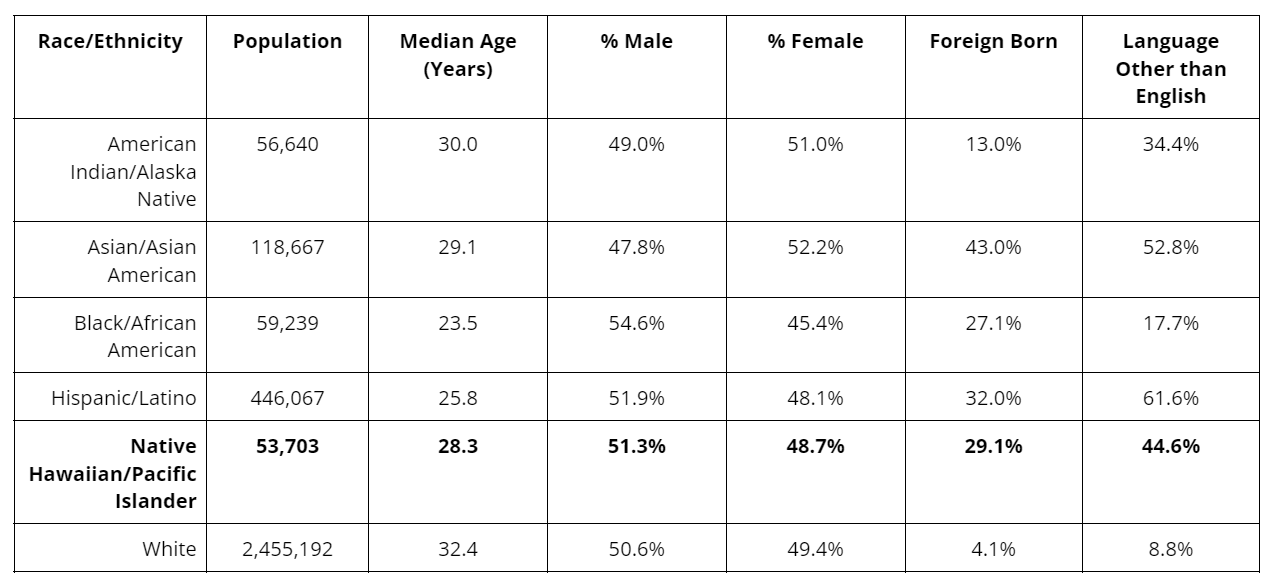
The median age of Native Hawaiian/Pacific Islander† populations in Utah is 28.3 years3, with a sex distribution of 51.3% male and 48.7% female.4 Almost one-third (29.1%) of Utah’s Native Hawaiian/Pacific Islander† populations were born outside of the U.S.5 Nearly half (44.6%) speak a language other than English at home.6
Less than one-in-five (19.2%) of Native Hawaiians/Pacific Islander† adults in Utah hold a bachelor’s degree or higher.7 The median annual income of Native Hawaiian/Pacific Islander‡ households in Utah is $76,975.8 The homeownership rate among Native Hawaiian/Pacific Islander‡ populations in Utah is 48.8%.9 The percent of Native Hawaiian/Pacific Islander† families living below poverty in Utah is 8.0%.10 The unemployment rate for Native Hawaiian/Pacific Islander† populations in Utah is 5.5%.11
*Races are reported alone or in combination with one or more other races; Ethnicity is reported Hispanic/Latino of any race.
*Native Hawaiian/Pacific Islander race alone or in any combination
**Native Hawaiian/Pacific Islander race alone or in combination with one or more races, regardless of ethnicity
†Native Hawaiian/Pacific Islander race alone, non-Hispanic
‡Native Hawaiian/Pacific Islander race alone, any ethnicity
1 U.S. Census Bureau 2016–2020 ACS 5-Year Estimates, Table B02019, Native Hawaiian and Other Pacific Islander Alone or In Any Combination by Selected Groups 2 U.S. Census Bureau 2016–2020 ACS 5-Year Estimates, Table DP05, ACS Demographic and Housing Estimates, Race alone or in combination with one or more other races 3 U.S. Census Bureau 2017–2021 ACS 5-Year Estimates, Table B01002E, Median Age by Sex (Native Hawaiian and Other Pacific Islander Alone) 4 U.S. Census Bureau 2017-2021 ACS 5-Year Estimates, Table B01001E, Sex by Age (Native Hawaiian and Other Pacific Islander Alone) 5 U.S. Census Bureau 2017-2021 ACS 5-Year Estimates, Table B05003E, Sex by Age by Nativity and Citizenship Status (Native Hawaiian and Other Pacific Islander Alone) 6 U.S. Census Bureau 2017-2021 ACS 5-Year Estimates, Table B16005E, Nativity by Language Spoken at Home by Ability to Speak English for the Population 5 Years and Over (Native Hawaiian and Other Pacific Islander Alone) 7 U.S. Census Bureau 2017-2021 ACS 5-Year Estimates, Table S1501, Educational Attainment (Native Hawaiian and Other Pacific Islander Alone) 8 U.S. Census Bureau 2018-2022 ACS 5-Year Estimates, Table S1903, Median Income in the Past 12 Months (in 2022 Inflation-Adjusted Dollars), Native Hawaiian and Other Pacific Islander Alone, any Ethnicity 9 U.S. Census Bureau 2018-2022 ACS 5-Year Estimates, Table S2502, Demographic Characteristics for Occupied Housing Units, Native Hawaiian and Other Pacific Islander Alone, any Ethnicity 10 U.S. Census Bureau. "Poverty Status in the Past 12 Months of Families." American Community Survey, ACS 5-Year Estimates Subject Tables, Table S1702, 2022 (Native Hawaiian and Other Pacific Islander Alone) 11 U.S. Census Bureau. "Employment Status." American Community Survey, ACS 5-Year Estimates Subject Tables, Table S2301, 2022 (Native Hawaiian and Other Pacific Islander Alone)